Current sheet decay as a united mechanism of the
phenomena associated with a solar flare
I.M. Podgorny1
and A.I. Podgorny2
1Institute
for Astronomy RAN, Moscow,
2Lebedev
Physical Institute,
Abstract. The solar flare is an explosive phenomena in the corona above an active region. The flare is
accompanied by ultra high-energy proton flux and coronal mass ejection that
initiates shock waves in the interplanetary space. The fast electron
precipitation into chromosphere produces visible
radiation, soft and hard x-rays. The beams of fast electron, accelerated
upward, produce radio bursts. According to the modern data all these phenomena
and their sequences can be explained in the frame of vertical current sheet
decay in the corona. This current sheet is not neutral one. It possesses the
normal magnetic field component. The plasma flow along the sheet supplies the
current sheet stability. The results of numerical 3D MHD simulations explain
all stages of solar flare.
Introduction
The
solar flare term was introduced by H. Newton in 1949 year for appearance of
bright local luminosity on the Sun, after which the strong Earth magnetospheric disturbances followed in tens of hours
later. The energy release in big flare is order of 1032 erg. Many
spacecraft measurements have demonstrated that a substorm
appears due to fast plasma cloud approach to the Earth magnetosphere. The fast
plasma ejection from the Sun has been named as a transient or Coronal Mass
Ejection (CME). About 1011 g of plasma are ejected from solar corona
at a typical CME. In 1993 the sensational Gosling paper appears. He declares
that "solar flares play no, fundamental role in producing large
geomagnetic storms". Some investigators consider Gosling statement as
wrong (Dryer, 1998; Podgorny and Podgorny, 2001), but others
have often accepted his statement. The reason for this misunderstanding
consists in very different conditions for observation of a solar flare and CME.
Solar flares are observed on the Sun disk as a local increasing of luminosity
in the visible light and X-rays, but CME can not be observed on the background
of the bright disk. CME can be seen, if the event appears on the limb. The
Gosling statement is also contradicts to the solar flare electrodynamical
model based on energy storage in the current sheet above an active region and
its fast release due to current sheet instability (Podgorny and Podgorny, 2001). According the electrodynamical model plasma is accelerated in the current
sheet during a flare and is ejected in the interplanetary space producing the
CME. This model has been discussed in previous Apatity
seminars.
Often,
a solar flare is accompanied by giant long-lived post flare loops. The giant
loop energy is comparable with the solar flare.
Time-table
of the solar explosive phenomena
Resent
observations of solar flare and CME appearance were
carried out near the limb. That permits to trace flare soft X-ray emission and
to observe CME development in visible region out of solar disk. The
observations demonstrate that both events (solar flare and CME) are produced
simultaneous in the same place (Zhang et
al., 2001). These data and some old observations permit to draw typical
time dependence for most representative phenomena of the explosive solar event
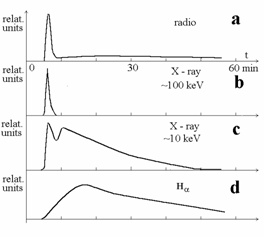
(Fig. 1). The narrow bursts of radio emissions (Fig. 1a) and hard X-ray (Fig.
1b) appear simultaneously. It should be noted that first burst of hard X-ray is
produced in the corona above an active region. It is connected with primary
energy release. The soft X-ray (Fig. 1c) and visible (Fig. 1d) radiation are
generated in the chromosphere. They are produced by
fast electrons that gain energy in field-aligned currents and precipitate in
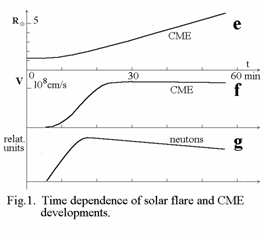
the chromosphere. Fig 1e and 1f show that plasma
acceleration of CME begins in the corona simultaneously with X-ray burst. So,
CME and solar flare are produced in the same explosive event. The time
dependence for neutron monitor curve presented in Fig. 1g is shifted left. This
shift takes into account that the neutrons are produced by flare high energy
protons (W>1 GeV) arriving to magnetosphere along
the Arhimed curve. The start of proton appearance
coincides with appearance of hard X-ray emission, but duration of neutron is
much longer. Apparently, the long duration of the neutron monitor pulse is
determined be diffusion transport of protons in the interplanetary space.


The temporal relationship between
presented in the Fig. 1 time distributions shows, that all main phenomena of
solar flares and CME are produced in the single explosive event in the corona.
Supra-arcade
downflow phenomena and post-flare loops
In a
number of explosive events, the soft X-ray images from Yohkoh
spacecraft indicate a downward directed flow field in the region located above
the flare arcade but below the place of primary energy release (McKenzie and Hudson, 2001). Plasma moves downward with the subalfvenic

Fig.2. Electrodynamical solar flare
model.
velocity. These flare
events has been associated with CME. It means that a flare is associated with
plasma acceleration upward and downward. Such conclusion is in agreement with
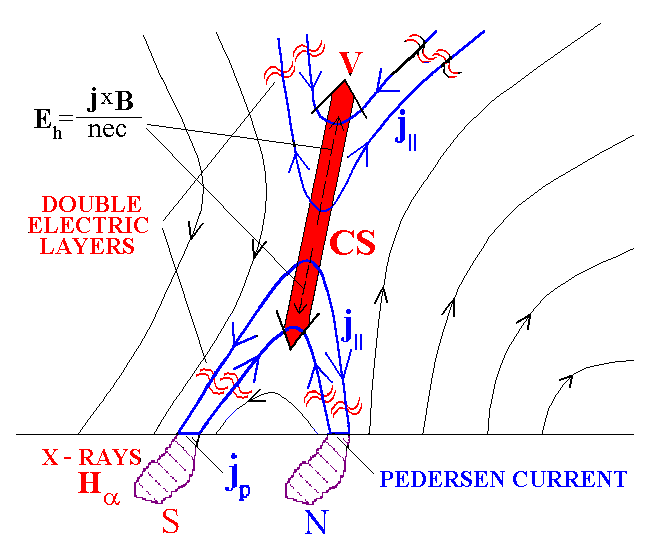
the flare electrodynamical model (Fig. 2). Fine lines
in Fig. 2 show magnetic field lines. The magnetic field configuration
corresponds to a vertical current sheet that appears above the active region
due to disturbances focusing in the vicinity of a singular (neutral) line (Podgorny, Podgorny,
2001). Thick lines show field-aligned currents generated by Hall electric field
j´B/nec in the current
sheet. Plasma inflows in the current sheet from the left and
from the right sides. It flows together with frozen-in magnetic lines.
After magnetic lines reconnection plasma flows along the sheet. The j´B/c force
accelerates plasma in both sides of a vertical current sheet (upward and
downward). During evolution the current sheet becomes unstable, and the force
increases rapidly. The downward acceleration is not so
effective as upward one, because downward flow meets strong magnetic field of
arcade. The plasma temperature in the flow increases during reconnection. This
hot plasma moves together with frozen-in magnetic field lines. The magnetic
lines are piled up on the top of a magnetic arc and produce a hot flare loop.
New field lines arrive with hot plasma. The flow pattern produces impression
that the bright front of a hot loop moves upward. Such development of loop with
hot plasma on its outer part is observed (Forbes, 2000). The shadow area shows
the hot part of the loop on the top of arcades in Fig. 2. The fast electrons
confined in the loop can produce long duration X-ray (Fig. 1c).
Bastille
solar flare
The
flare Bastille appeared

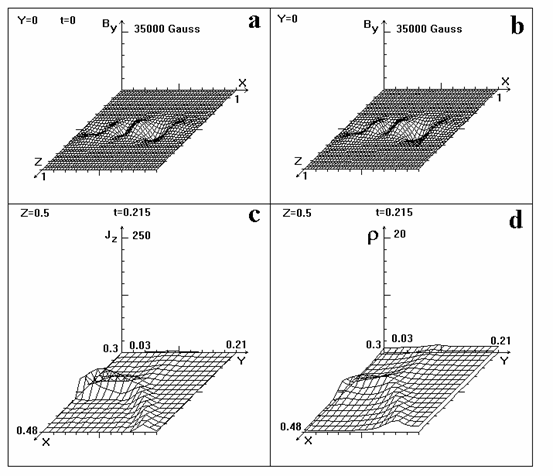
Fig. 3. Magnetic field distributions on the photosphere (a and b), current (c) and density (d) distributions in the
current sheet.
Fields
of vertical magnetic dipoles placed below the photosphere approximate the
magnetic field of NOAA 9077 active region. Each of dipoles simulates a certain
magnetic spot. Four days prior to the flare the spot 3 has been increased in
two times. The dipole 6 has been increased between June 10 and 12. The magnetic
field By distribution on the photosphere
before magnetic field changing is presented in Fig. 3a. This magnetic field
contains the neutral line above dipole 4. Fig. 3b shows the same distributions
as in Fig. 3a, but for the new dipole values. The linear interpolation of
magnetic field change is set in the photospheric
boundary condition.
The
results of MHD numerical simulation
demonstrate current sheet appearance in the vicinity of the neutral line due to
photospheric magnetic field change. Distributions of
current density and plasma density in the current sheet are shown in Fig. 3c
and Fig. 3d respectively. The current sheet is divided into two branches
("moustaches") at its upper age. Such behavior of plasma parameters
corresponds to creation of slow shocks, which Petschek
has predicted.
The numerical results show that energy accumulated in
the current sheet òòòB2dv - òòòB2potentialdv is
about 5´1032 erg. 3D integrals are taken in the vicinity of CS. Decay
of this CS can produce a powerful solar flare. It should be emphasized that the
numerical experiment has been carried out without any assumption about the
mechanism of solar flare production. We just use photospheric magnetic
measurements as the boundary conditions and calculate magnetic field
distribution above the of NOAA 9077 active region. Calculations demonstrate
current sheet creation and energy storage due to focusing of MHD disturbances
that arrive from the photosphere. These disturbances are generated during preflare change of the magnetic field in the active region.
Conclusion
There
are many observational data that confirm that the validity of the electrodynamical flare model based on a current sheet decay
above the active region. Flares and CME appear in the same explosive events.
Plasma ejected upward from the vertical current sheet producing a CME. Plasma
ejection downward is responsible for hot plasma production on the outer part of
a post flare loop. Long duration X-ray radiation can be explained by fast
electron confinement in the loop.
Numerical
MHD experiments demonstrate current sheet creation above an active region due
to focusing MHD disturbances that arrived from the photosphere. The only
necessary condition for current sheet creation is existence of the magnetic
singular (neutral) line and corresponding photospheric
disturbances. No assumption about the
mechanism of solar flare production is introduced in these experiments.
Acknowledgments. This work was supported by
Russian Foundation for Basic Research (project
References
Bilenko I. A., Podgorny A. I., Podgorny I. M.
Current sheet above the NOAA 9077 active region prior to the flare on 2000 July
14. Solar Phys.
2002. In press.
Dryer M. et al. The
solar minimum active region 7978, its 2.6X/1B flare, CME, and interplanetary
shock propagation on
Forbes T. G. Solar
and stellar flares. Phil. Trans.
Soc. Lond. A. 358, 711, 2000.
Gosling J. T. The
solar flare myth. Journ. Geophys. Res. 98, 18937, 1993.
McKenzie D. E. and
H. S. Hudson. Downflows and structure above LDE arcade:
Possible signature of reconnection? Earth Planet Space. 53, 577, 2001.
Podgorny A.
Podgorny A.
Zhang J., Dere
K. P. Howard R. A. et al. On the temporal relationship
between CME and flares. Astrophys. J. 599, 452, 2001.